

8th Grade Math Course
How can we use mathematical tools and logical reasoning to discover patterns, prove relationships, and model the world around us?

We embark on a journey of discovery, uncovering patterns in exponents and proving relationships with roots. We start by exploring large positive numbers and discovering how writing them as a single digit times a power of 10 reveals hidden patterns. This leads us to the formal definition of scientific notation. We then dive into operating with these numbers, discovering the need for the properties and definitions of exponents to make our calculations more efficient. Finally, we reason intuitively about square roots and cube roots, and explore the Pythagorean theorem, which reveals the relationship between side lengths of right triangles and leads us to understand square root notation, approximations, and the definition of irrational numbers. We prove and connect mathematical ideas throughout.

Moving forward, we discover patterns in geometric transformations and prove relationships between angles. We explore rigid motions (translations, reflections, rotations) using hands-on activities and learn precise language to describe them. We define congruence through sequences of these motions and then use this understanding to prove facts about angles formed by parallel lines and transversals. Building on our previous knowledge, we prove the sum of triangle interior angles and explore the relationship between exterior and remote interior angles. We discover and prove geometric relationships through hands-on exploration and logical deduction.
Deepening our understanding, we discover the patterns of similarity and prove relationships between figures. We start by analyzing how dilations differ from rigid motions and explore their connection to scale drawings. We use various tools to draw images of figures under dilations, revealing the patterns of proportional change. We then define similar figures as those that can be mapped onto each other by rigid motions or dilations, or both, proving that similarity is a distinct relationship. We discover and prove the angle-angle criterion for similarity and then use this knowledge to prove whether two triangles are similar. Finally, we apply our understanding of similarity to solve for unknown side lengths in triangles, tackling both mathematical and real-world problems, thus demonstrating the power of discovered and proven relationships.
Charting our course, we discover the patterns within linear equations and prove relationships between their solutions. We explore one-variable equations, proving that they can have one, infinite, or no solutions. We then progress to two-variable equations, discovering that their solutions form ordered pairs and, when graphed, create lines. We prove the infinite nature of these solutions. We use proportional relationships and similar triangles to prove and understand the concept of slope and then use this understanding to develop the slope-intercept and point-slope forms of linear equations, thus revealing the interconnectedness of algebra and geometry.
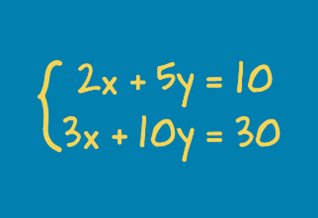
Next, we discover patterns in systems of linear equations and prove relationships between their solutions. We start by graphing systems, estimating intersection points, and proving that these points are solutions. We then analyze systems to prove the number of possible solutions. Discovering the limitations of graphical estimation for fractional solutions, we introduce the substitution method, proving its effectiveness in finding precise solutions. Equipped with these tools, we challenge ourselves to write and solve systems arising from diverse contexts, thus demonstrating the power of discovered solution methods.
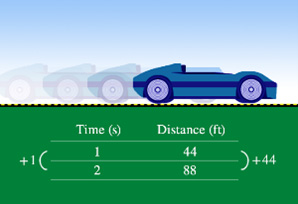
Now, we discover patterns in functions and prove relationships within data and volume. We explore the definition of a function, proving that each input has a unique output. We write equations for linear functions, proving the connection between rate of change, initial value, and context. We use scatter plots to discover patterns in bivariate data, drawing lines of best fit and proving their equations. We analyze categorical data with two-way tables, proving associations between variables. Finally, we develop volume formulas for pyramids, cylinders, cones, and spheres, and use linear functions to solve real-world volume problems, thus connecting algebraic functions to geometric volumes.

We are here to equip, inspire and enrich the strengths of all learners with relevant educational experiences for lifelong learning.
Every day we strive to provide a world-class education that is equitable, empowering and inspiring for all.
Learn more about our programs & resources.
C&I Department
520-225-6282
1010 E. Tenth St., Tucson, AZ 85719 Map (google.com)