

8th Grade Algebra Course
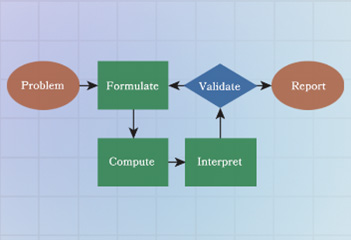
How can we use functions to model, analyze, and interpret relationships between quantities in real-world contexts?

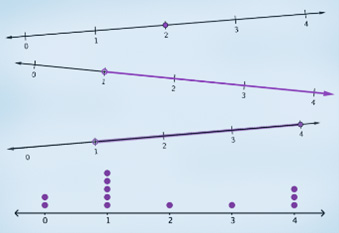
We begin by building foundational models using expressions, equations, inequalities, and data distributions in one variable. We learn how to add, subtract, and multiply polynomial expressions, creating models for various relationships. We then construct and solve linear equations and inequalities, including compound inequalities, using set notation, set-builder notation, and graphs on the number line to accurately represent solution sets – these solution sets are essentially models that show possible values for our variables. Finally, we use graphical displays and measures of center and spread to analyze and compare univariate data sets, creating statistical models that help us understand and interpret real-world information. We use these one-variable tools to build the groundwork for more complex functional models later in the course.
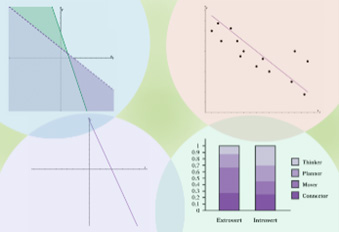
In this module, we expand our modeling toolkit. We graph linear equations and inequalities on the coordinate plane, creating visual models of relationships between two quantities. We solve systems of linear equations both graphically and algebraically, building models that represent the intersection of two relationships. We also graphically represent solution sets of systems of linear inequalities, creating models of overlapping constraints. For quantitative data, we use the line of best fit, residuals, and the correlation coefficient to analyze bivariate data, building linear models that capture trends and relationships. For categorical data, we examine possible associations between variables using frequencies, relative frequencies, and conditional relative frequencies, developing models that reveal patterns and dependencies within the data. We use these two-variable tools to build sophisticated functional models that accurately reflect real-world situations.
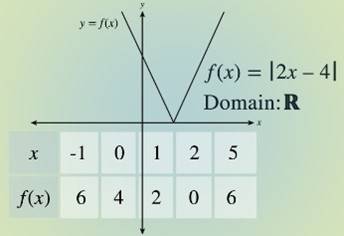
Next, we delve deeper into how we represent and interpret functional models. We learn to translate between verbal descriptions, tables, graphs, and equations, building a comprehensive understanding of how functions model relationships. We use function notation to represent functions concisely and interpret statements within a context, refining our ability to communicate with functional models. We identify and interpret key features of functions and their graphs, connecting these features to real-world scenarios. We explore piecewise-defined linear functions, including the absolute value function and step functions, modeling situations with varying conditions. Finally, we learn to graph transformations of functions, allowing us to model how changes in input affect output and build more adaptable functional models.
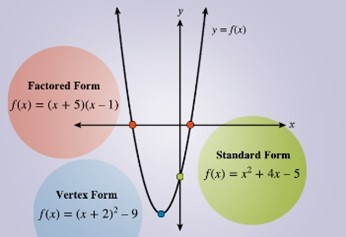
Moving forward, we build quadratic models to represent and analyze real-world scenarios, particularly focusing on projectile motion. We identify and interpret key features of quadratic functions and their graphs, connecting these features to the context of how objects move through the air. We use factoring to solve quadratic equations and find the zeros of functions, which helps us model when a projectile hits the ground. We then master completing the square, using it to solve equations, derive the powerful quadratic formula, and reveal the vertex of a parabola, which models the maximum height of a projectile. We also explore graphing quadratic functions using symmetry and transformations, building visual models of projectile paths. Finally, we learn to create quadratic function models from real-world situations and data sets, using these models to solve practical problems related to projectile motion and other phenomena. We utilize quadratic functions to create powerful predictive models.
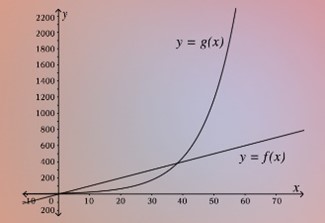
Now, we expand our modeling capabilities to include exponential functions and sequences, uncovering patterns of growth and decay. We recognize sequences as functions and learn to write recursive and explicit formulas, building models that describe patterns of change. We connect our understanding of geometric sequences to the development of exponential functions, creating models for scenarios where quantities change at a constant percentage rate. We graph exponential functions and identify key features, interpreting these features within real-world contexts. We use exponential functions to model exponential growth and decay, capturing phenomena like population growth or radioactive decay. Finally, we create and compare linear and exponential models for real-world situations, determining which type of model best represents the given data and building our ability to choose the most effective functional model for any scenario.
Lastly, we refine our ability to build and select the best functional models for real-world data. We revisit bivariate quantitative data, critically analyzing whether a linear or nonlinear model provides the most accurate representation. When data suggests a nonlinear relationship, we delve deeper, determining whether a quadratic or exponential model offers a superior fit. This process allows us to build increasingly precise and nuanced models. Finally, we synthesize and apply our accumulated knowledge from modules 1-5, tackling a variety of comprehensive modeling tasks. These tasks challenge us to use our full range of functional modeling skills to represent and solve complex real-world problems, solidifying our ability to use functions as powerful tools for understanding and predicting the world around us.

We are here to equip, inspire and enrich the strengths of all learners with relevant educational experiences for lifelong learning.
Every day we strive to provide a world-class education that is equitable, empowering and inspiring for all.
Learn more about our programs & resources.
C&I Department
520-225-6282
1010 E. Tenth St., Tucson, AZ 85719 Map (google.com)